Ontario Varroa Mite Monitoring Campaign: 2022 Update and Graphs
Thank you to all the beekeepers (both commercial and hobbyist) who followed the steps, sampled their varroa mites and provided us with the data.
This provides information on the varroa mite levels beekeepers are experiencing in their colonies this season.
Some early takeaway messages from the data:
- In many cases the varroa levels appear to be lower, or well under control
- This is demonstrated by the levels below the established thresholds for treatment
- This appears to be good news
- However, keep in mind:
- This data may not be entirely representative of varroa levels for all of Ontario
- Varroa levels can vary greatly by beeyard and colony
- There are some high levels of varroa occurring with the dataset (see maximum values)
- The most important data is the data from your own colonies.
- While this summary may be a useful comparison it is not a replacement for the data on your own varroa mite sampling
- Varroa levels increases exponentially, with the growth greatly accelerating in late summer and into fall
- Treatments are important to keep these levels under control
- These treatments have their limitations and varroa mites can spread to your bees from other nearby beeyards through robbing taking place in fall
- This data may not be entirely representative of varroa levels for all of Ontario
Continue to sample for varroa and monitor you varroa mite levels in you colonies.
More info here: https://www.oahn.ca/resources/varroa-monitoring/
Data
Alcohol Wash
| July 1 – July 21 | July 22 – August 11 | August 12 – September 1 | September 2 – September 22 | |
| Median | 1 | 1 | 1 | 1.5 |
| Mean | 1.3 | 1.9 | 1.8 | 4.3 |
| May treatment threshold | 2.0 | 2.0 | 2.0 | 2.0 |
| August treatment threshold | 3.0 | 3.0 | 3.0 | 3.0 |
| Count (n) | 61 | 149 | 120 | 42 |
| Min | 0 | 0 | 0 | 0 |
| Max | 7 | 33 | 31 | 29 |

Sticky Board
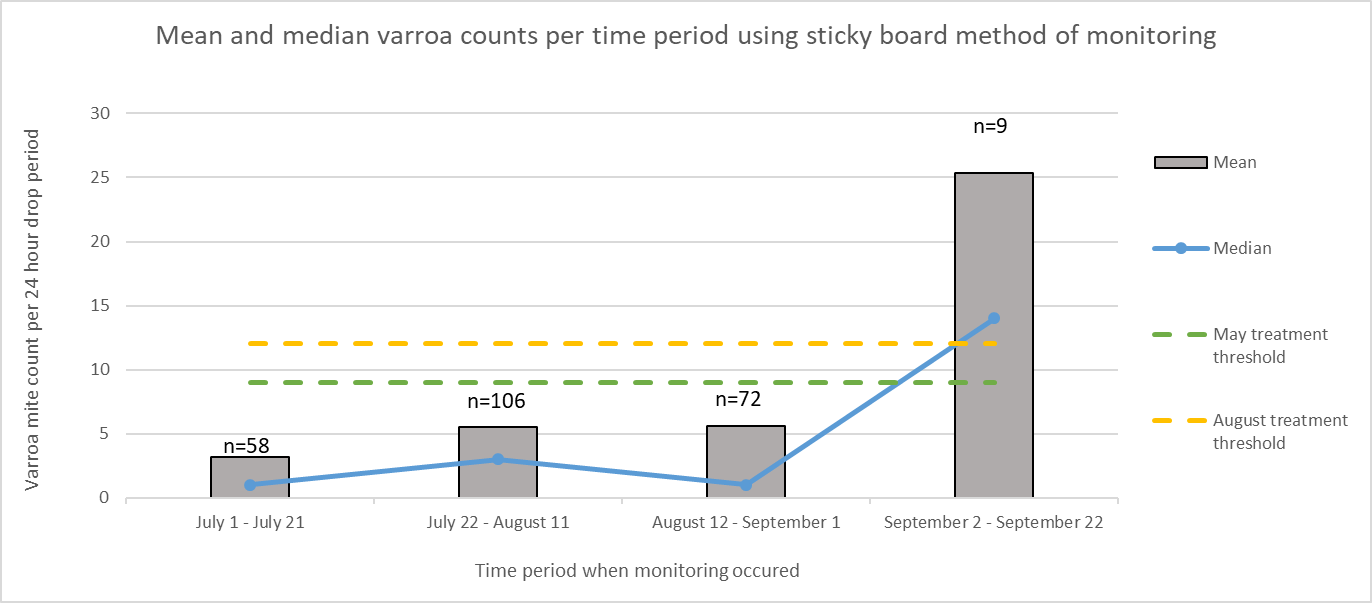
| July 1 – July 21 | July 22 – August 11 | August 12 – September 1 | September 2 – September 22 | |
| Median | 1 | 3 | 1 | 14 |
| Mean | 3.2 | 5.5 | 5.6 | 25.3 |
| May treatment threshold | 9.0 | 9.0 | 9.0 | 9.0 |
| August treatment threshold | 12.0 | 12.0 | 12.0 | 12.0 |
| Count (n) | 58 | 106 | 72 | 9 |
| Min | 0 | 0 | 0 | 7 |
| Max | 60 | 54 | 104 | 82 |


